← AI HoodmanNo. 010 · Recommendations

Percentile Watch Time

Which video did they enjoy more?

01of 07
Use the arrows, swipe or the arrow keys to turn the slides. Click a slide to read it page by page.
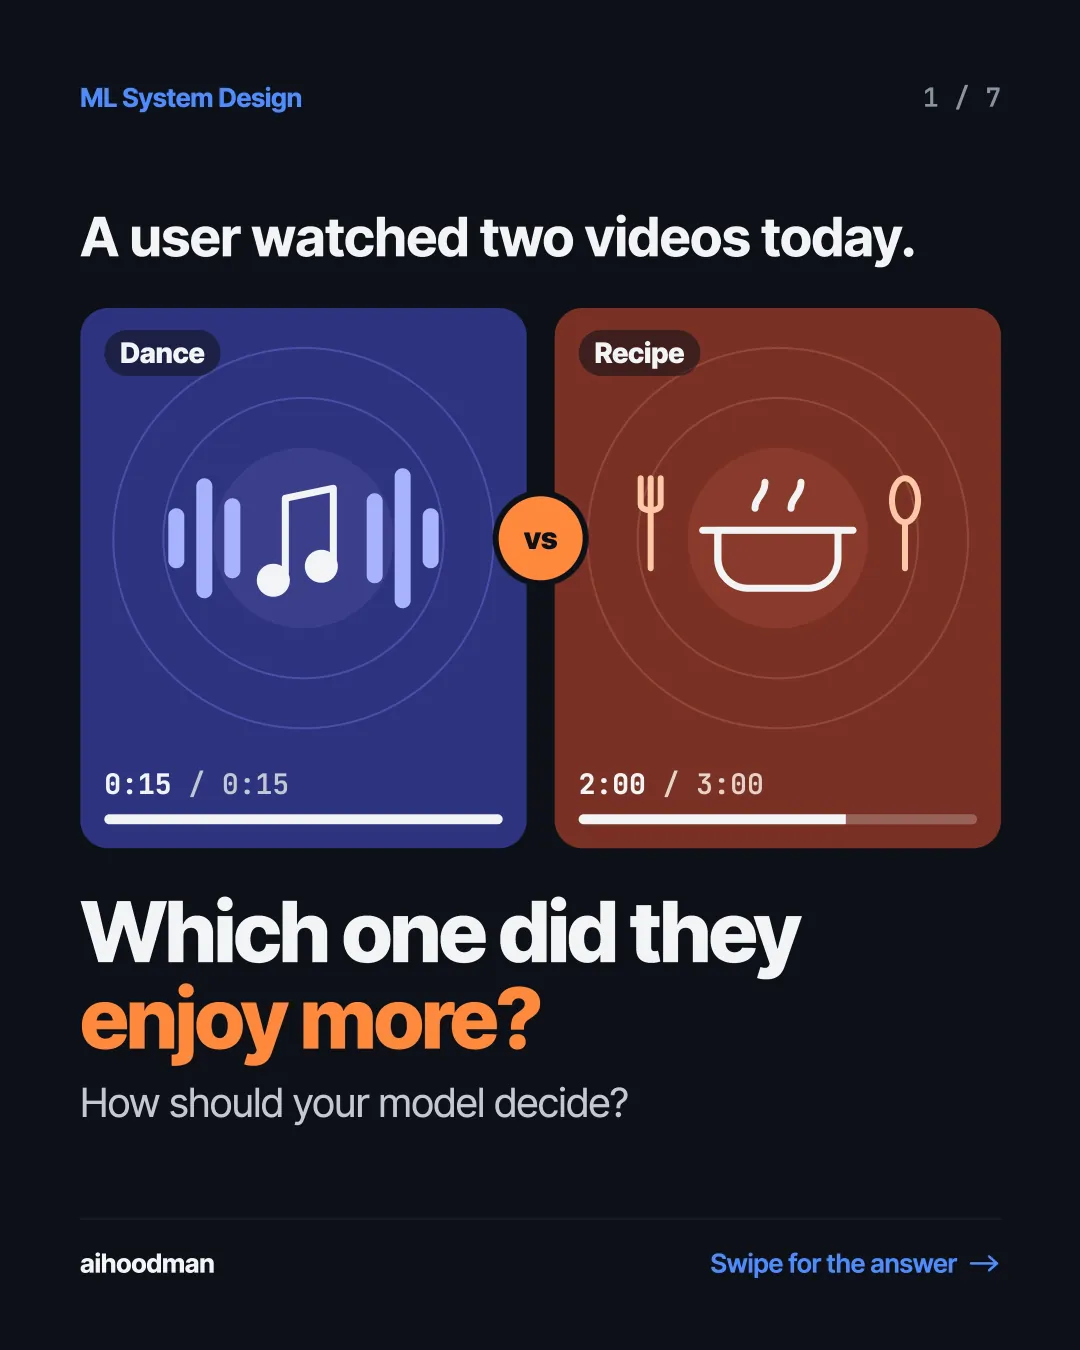
  1. Slide 1 of 7: A user watched two videos today. Dance Recipe vs 0:15 / 0:15 2:00 / 3:00 Which one did they enjoy more? How should your model decide?
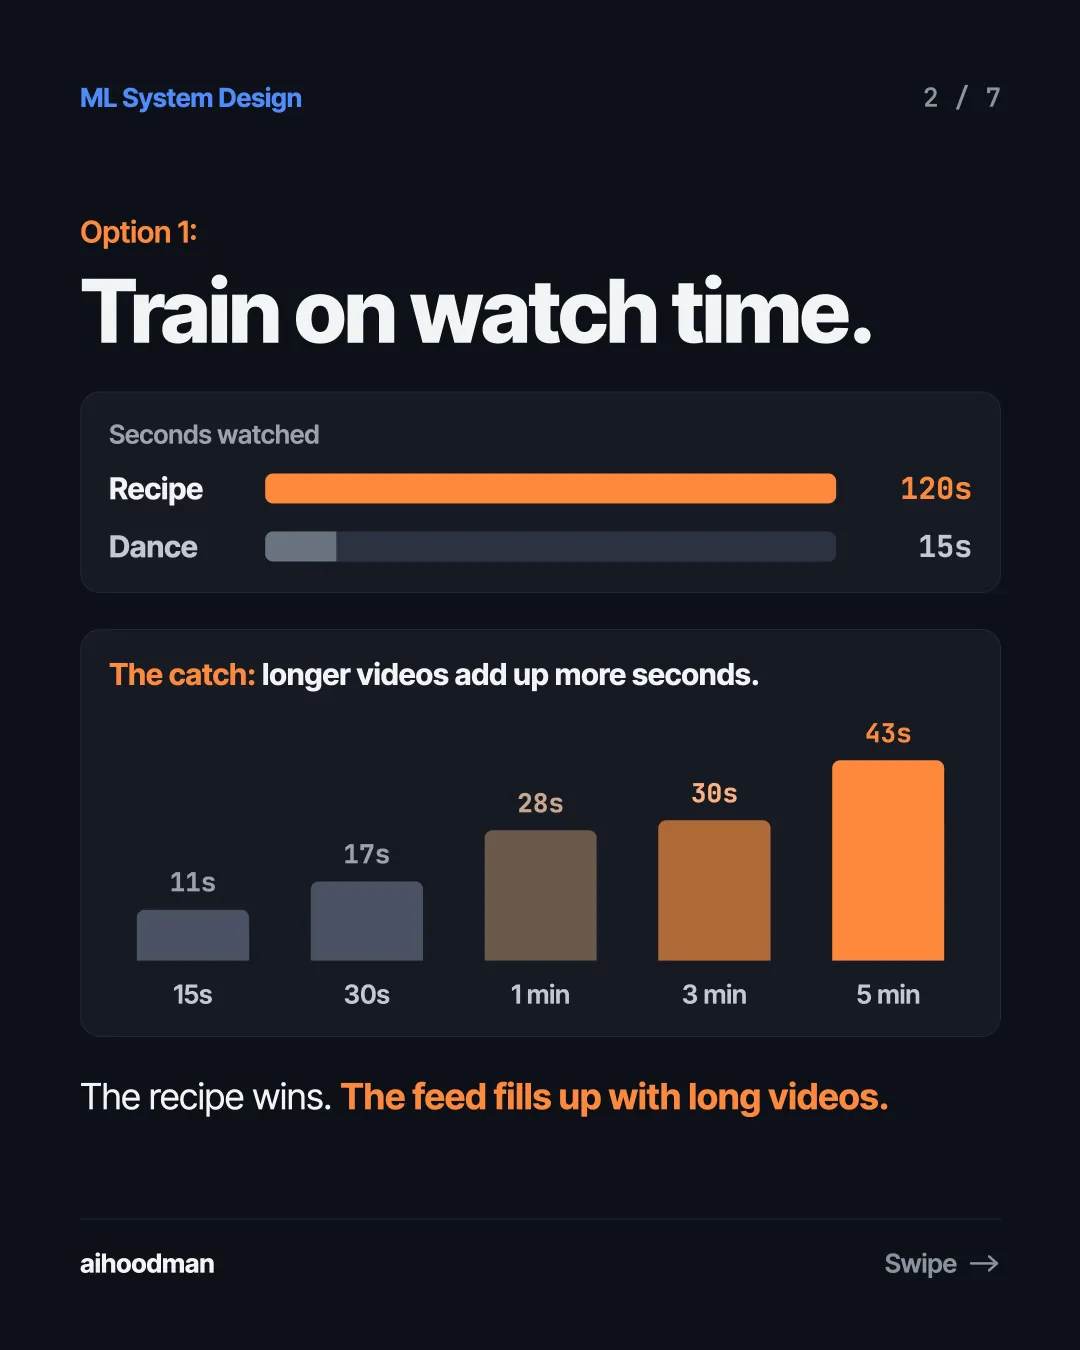
  2. Slide 2 of 7: Option 1: Train on watch time. Seconds watched Recipe 120s Dance 15s The catch: longer videos add up more seconds. 43s 28s 30s 1 min 3 min 17s 11s 15s 30s 5 min The recipe wins. The feed fills up with long videos.
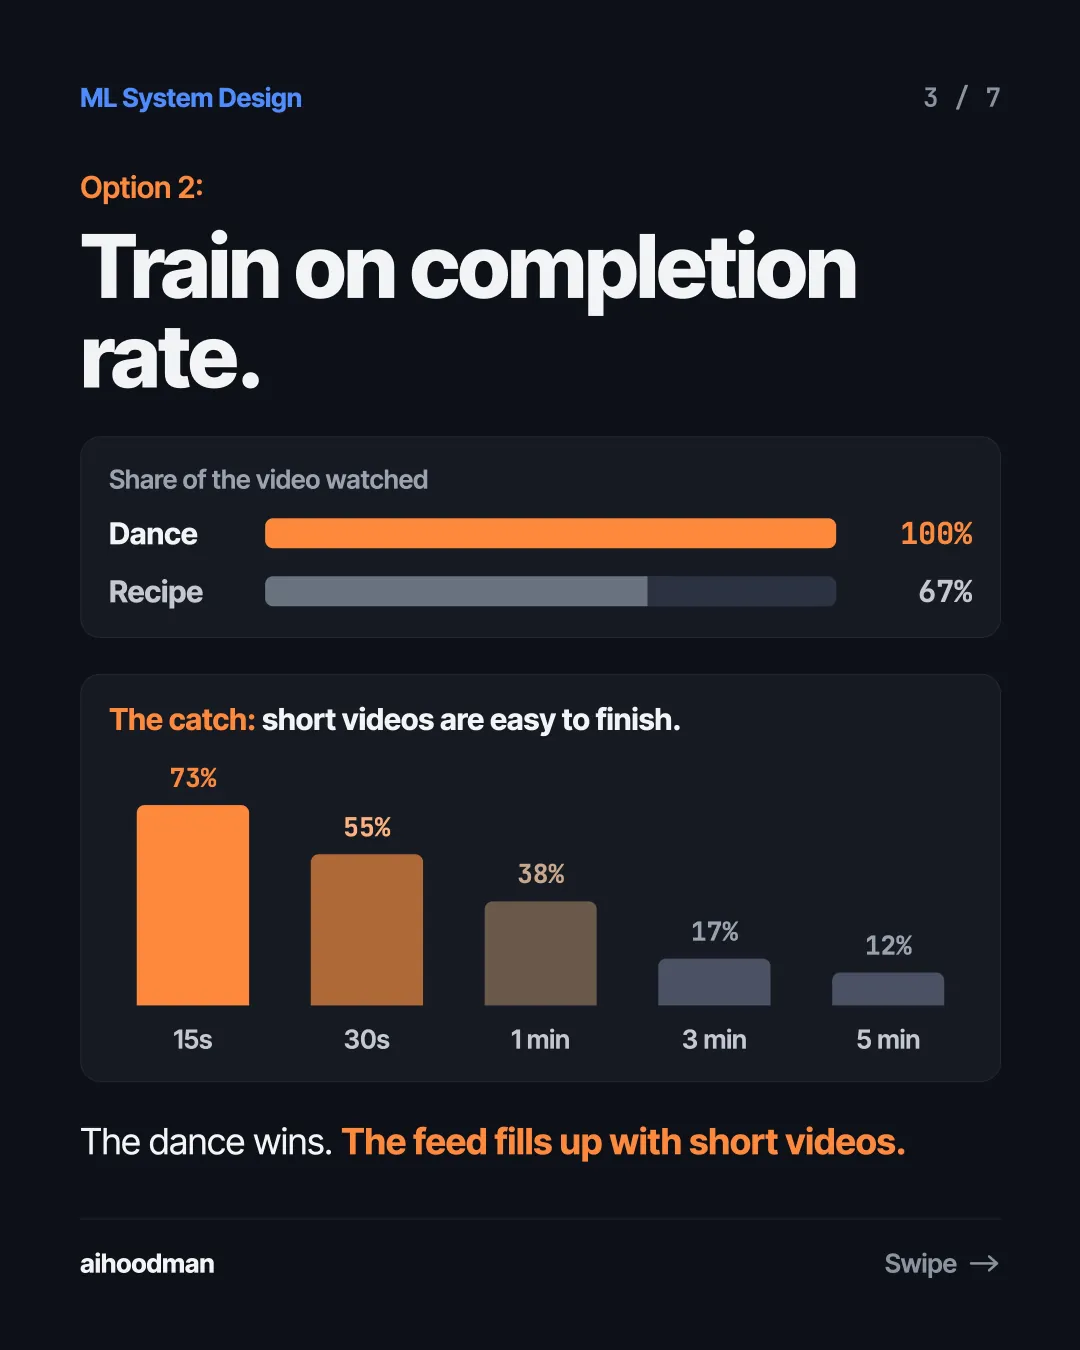
  3. Slide 3 of 7: Option 2: Train on completion rate. Share of the video watched Dance 100% Recipe 67% The catch: short videos are easy to finish. 73% 55% 38% 17% 15s 30s 1 min 3 min 12% 5 min The dance wins. The feed fills up with short videos.
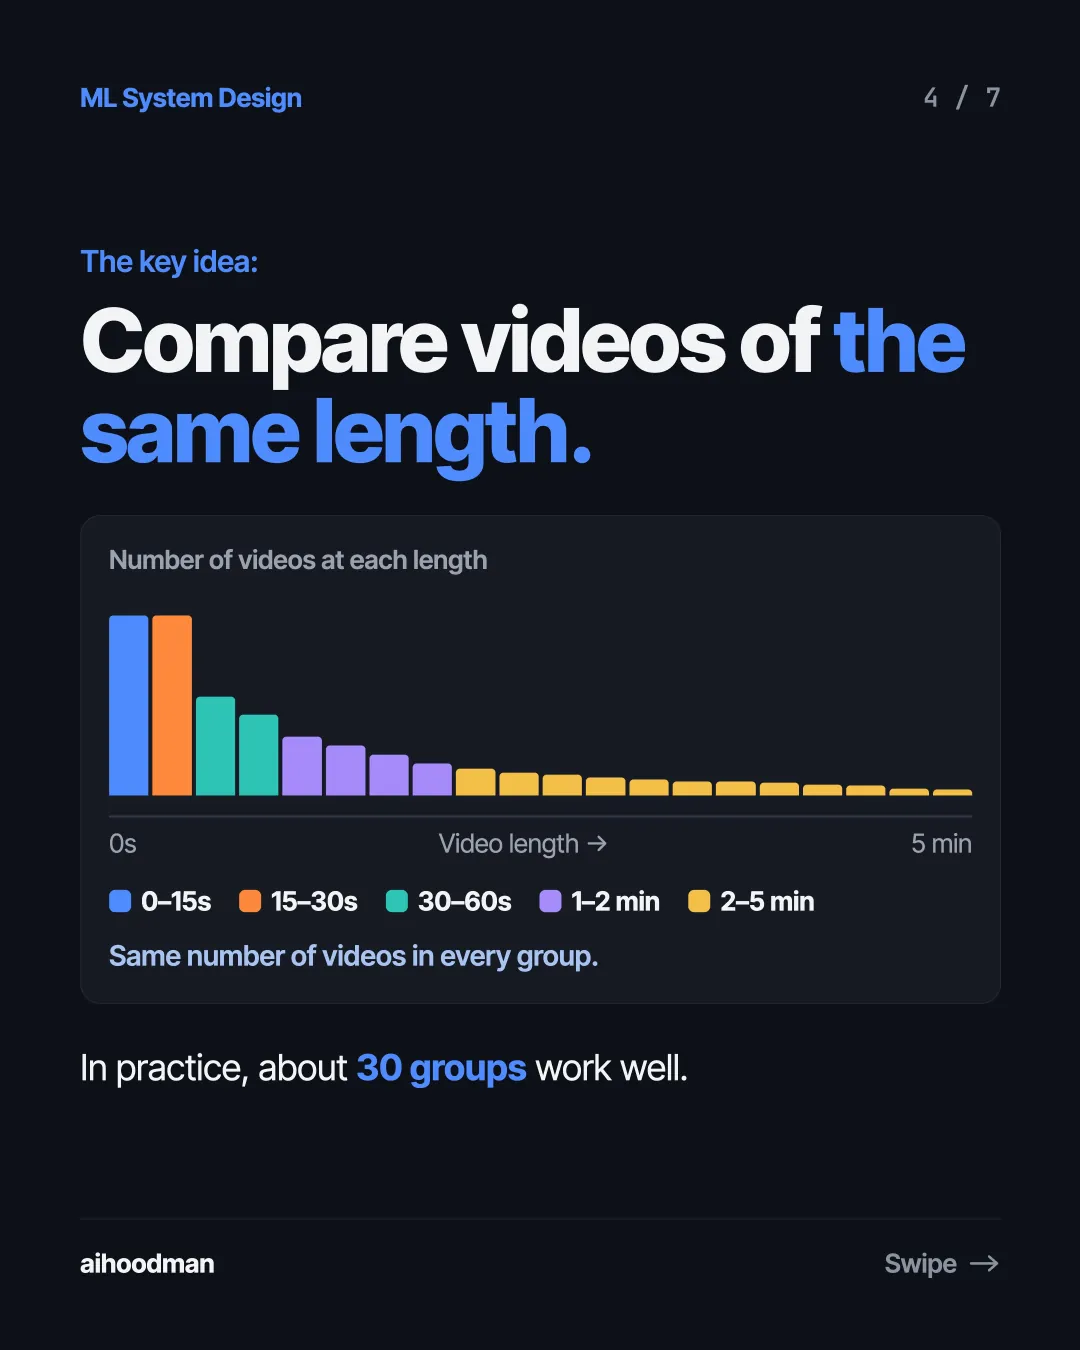
  4. Slide 4 of 7: The key idea: Compare videos of the same length. Number of videos at each length 0s Video length → 0–15s 15–30s 30–60s 1–2 min 5 min 2–5 min Same number of videos in every group. In practice, about 30 groups work well.
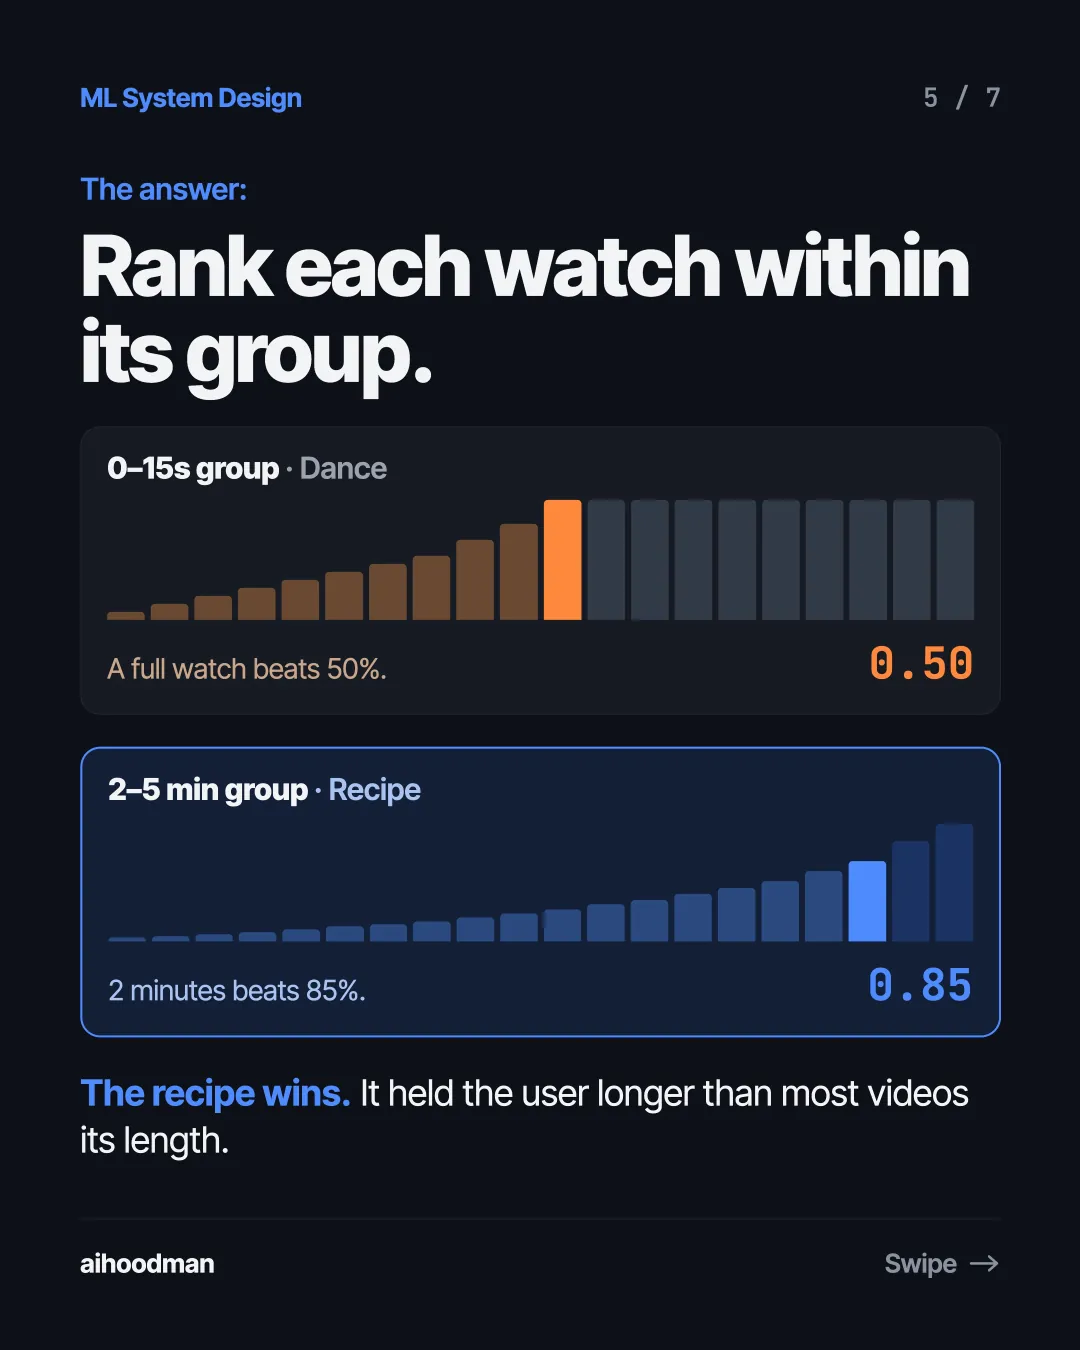
  5. Slide 5 of 7: The answer: Rank each watch within its group. 0–15s group · Dance A full watch beats 50%. 0.50 2–5 min group · Recipe 2 minutes beats 85%. 0.85 The recipe wins. It held the user longer than most videos its length.
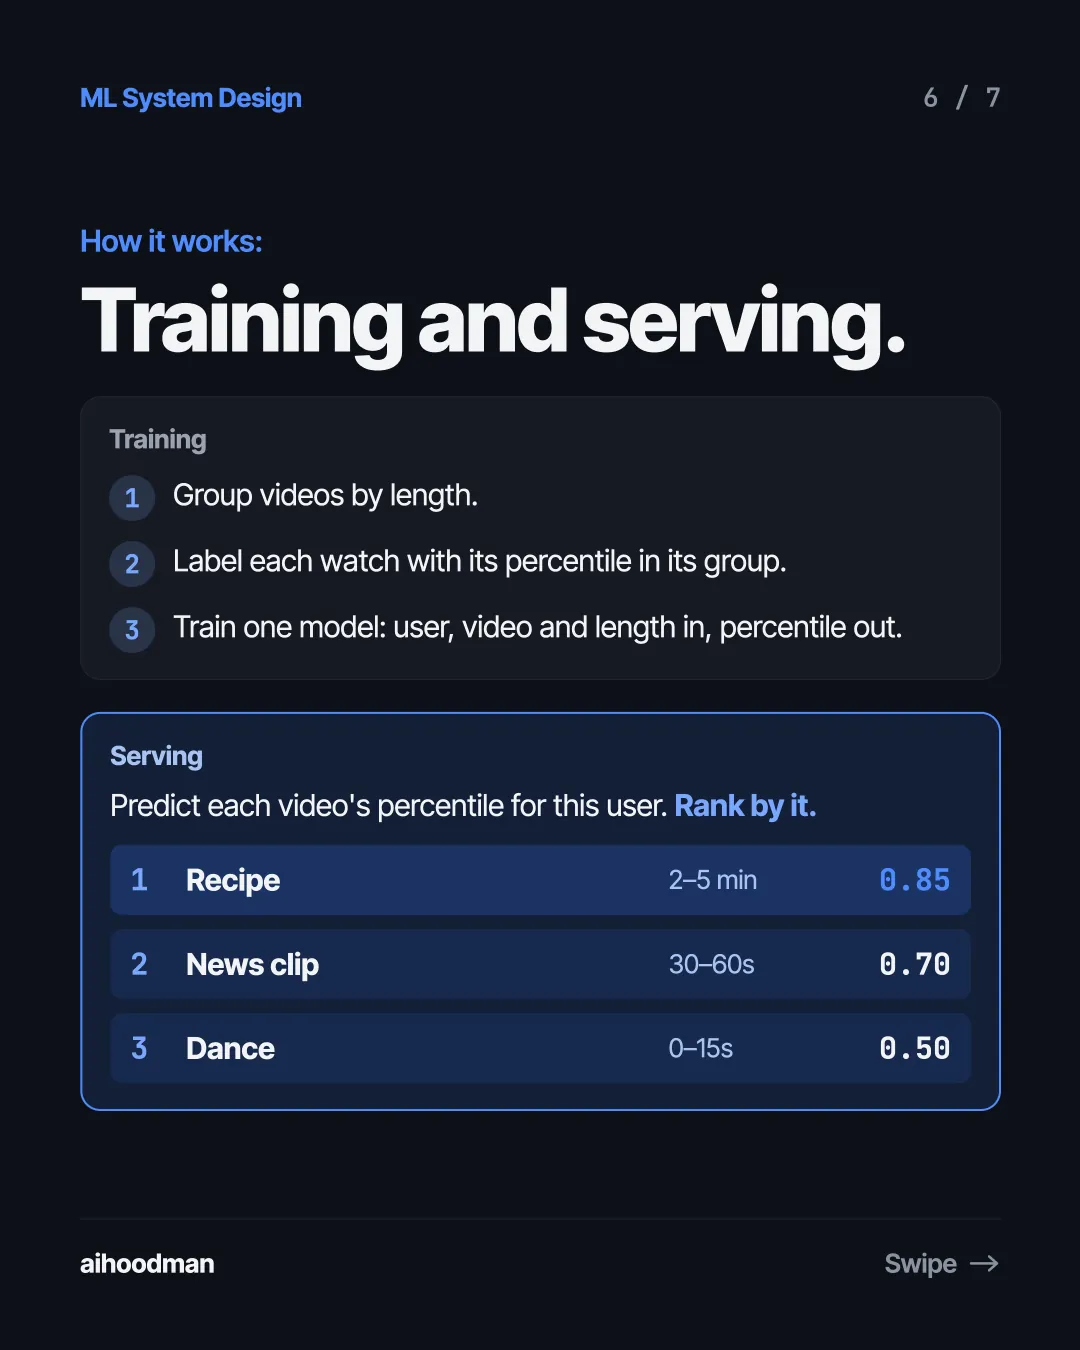
  6. Slide 6 of 7: How it works: Training and serving. Training 1 Group videos by length. 2 Label each watch with its percentile in its group. 3 Train one model: user, video and length in, percentile out. Serving Predict each video's percentile for this user. Rank by it. 1 Recipe 2–5 min 0.85 2 News clip 30–60s 0.70 3 Dance 0–15s 0.50
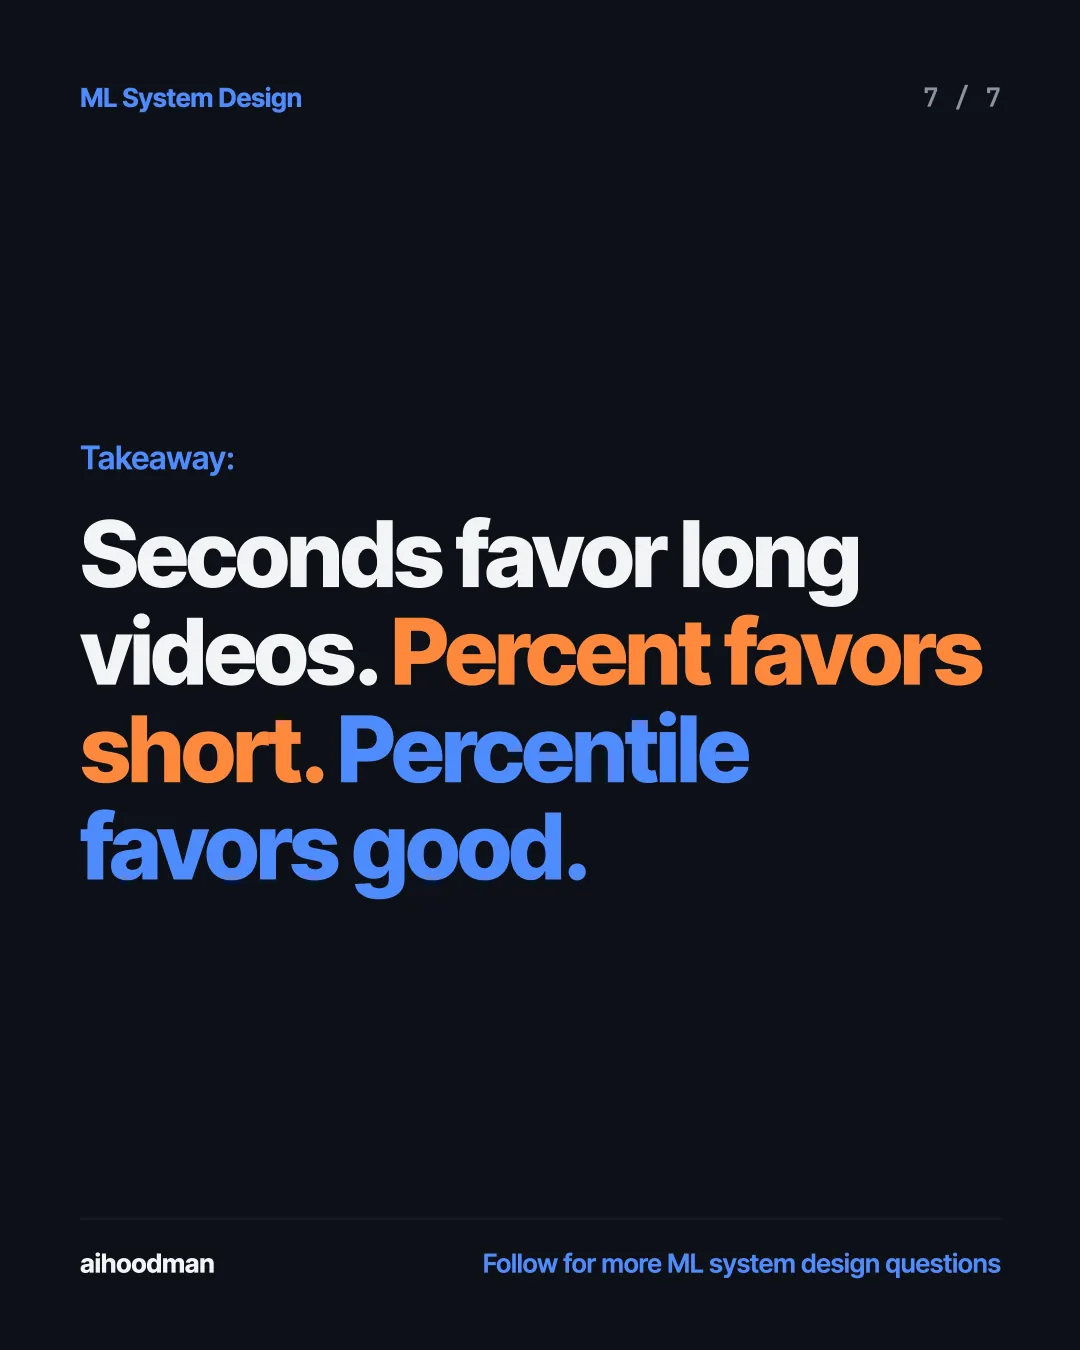
  7. Slide 7 of 7: Takeaway: Seconds favor long videos. Percent favors short. Percentile favors good.

Keep reading

Percentile Watch Time · 1 / 7
  1. Slide 1 of 7: A user watched two videos today. Dance Recipe vs 0:15 / 0:15 2:00 / 3:00 Which one did they enjoy more? How should your model decide?
  2. Slide 2 of 7: Option 1: Train on watch time. Seconds watched Recipe 120s Dance 15s The catch: longer videos add up more seconds. 43s 28s 30s 1 min 3 min 17s 11s 15s 30s 5 min The recipe wins. The feed fills up with long videos.
  3. Slide 3 of 7: Option 2: Train on completion rate. Share of the video watched Dance 100% Recipe 67% The catch: short videos are easy to finish. 73% 55% 38% 17% 15s 30s 1 min 3 min 12% 5 min The dance wins. The feed fills up with short videos.
  4. Slide 4 of 7: The key idea: Compare videos of the same length. Number of videos at each length 0s Video length → 0–15s 15–30s 30–60s 1–2 min 5 min 2–5 min Same number of videos in every group. In practice, about 30 groups work well.
  5. Slide 5 of 7: The answer: Rank each watch within its group. 0–15s group · Dance A full watch beats 50%. 0.50 2–5 min group · Recipe 2 minutes beats 85%. 0.85 The recipe wins. It held the user longer than most videos its length.
  6. Slide 6 of 7: How it works: Training and serving. Training 1 Group videos by length. 2 Label each watch with its percentile in its group. 3 Train one model: user, video and length in, percentile out. Serving Predict each video's percentile for this user. Rank by it. 1 Recipe 2–5 min 0.85 2 News clip 30–60s 0.70 3 Dance 0–15s 0.50
  7. Slide 7 of 7: Takeaway: Seconds favor long videos. Percent favors short. Percentile favors good.